 Unit
Four: Judgment: Data Reporting
Unit
Four: Judgment: Data Reporting4.0 Introduction to Judgment
No research or evaluation project is completed until the results are reported including conclusions and recommendations. Research requires that you try to find answers to the research "question."
![]()
4.1 Using Visuals: A Picture is Worth 1,000 Words
The last stage of a research project is to communicate the information gathered to the individuals who will use it in decision making. Visual representation of the data findings can simplify and help organize the findings.
Visuals should be simple as possible, not complicated to read. Each part should be clearly labeled and visually pleasing with neat spacing, a lot of white space and easy to read fonts. Visuals and text should work together and support the findings as presented.
Tables are the most common form of visuals used for displaying data. Tables present a large amount of data in a small amount of space. They usually show numerical values.
Example of a Table
Issue
|
1
Not Important |
2
Somewhat Important |
3
Important |
4
Very Important |
|
Developing additional
parkland (49) |
24.4 |
38.7 |
24.4 |
12.2 |
|
Improving existing
facilities. (41) |
0 |
24.3 |
48.7 |
51.2 |
|
Modifying existing
recreation facilities to meet the interests and needs of residents. (42) |
2.3 |
21.4 |
52.3 |
47.6 |
|
Providing more
recreation programming for children. (51) |
1.9 |
13.4 |
49 |
35.2 |
|
Providing after
school programs for children. (52) |
3.8 |
19.2 |
40.3 |
36.5 |
|
Providing recreation
opportunities for tourists. (50) |
14 |
44 |
28 |
14 |
|
Providing bicycle
paths and trails. (50) |
12 |
46 |
28 |
14 |
|
Providing special
events and programs. (51) |
7.8 |
37.2 |
37.2 |
17.6 |
|
Protecting open space
from development. (50) |
18 |
26 |
22 |
34 |
|
Making neighborhoods
more attractive places. (44) |
2.2 |
18.1 |
34.0 |
45.4 |
|
Preserving
environmentally and historically sensitive places. (51) |
3.9 |
17.6 |
33.3 |
45 |
|
Providing play areas
for young children. (49) |
2.0 |
14.2 |
40.8 |
42.8 |
|
Providing sports
facilities. (52) |
5.7 |
25.0 |
44.2 |
25.0 |
|
Providing cultural
facilities and programs. (50) |
6.0 |
30.0 |
46.0 |
18.0 |
|
Providing facilities
for senior citizens. (51) |
3.8 |
31.3 |
39.2 |
25.4 |
|
Providing recreation
facilities for teenagers. (53) |
1.8 |
13.2 |
45.2 |
39.6 |
|
Providing
well-maintained buildings and grounds. (51) |
1.9 |
9.8 |
41.1 |
47.0 |
|
Providing safe park
and recreation areas. (43) |
0 |
4.6 |
39.5 |
55.8 |
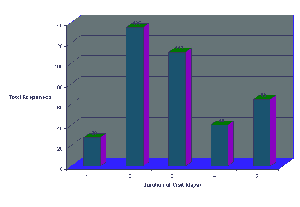
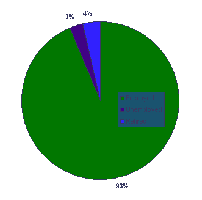
Figures are any type of illustration, other than a table. A figure can be a chart, graph, photograph, drawing or any other graphic depiction. The figure should convey essential facts and be easily read, understood and carefully prepared.
a. graphs, show relations, comparisons and/or distributions in a
set of data.
b. line graphs - bar graphs - pie graphs - scatter graphs - pictorial graphs
c. charts, describe the relations between parts of a group, object, or sequence
of operations in a process. Charts are usually boxes connected with lines.
Guidelines for figures:
|
Put table numbers (in Arabic numbers) and the title at the top of the figure. | |
|
Indicate on the figure itself (either at the bottom or with the title) the source of the data, if it is not directly from your research data. | |
|
Use notes in the form of superscript letters if you need to explain anything further about the table. You can put superscript letter next to a heading and then explain its meaning under the figure. | |
|
For figures that have data cases, always include the number of respondents at the bottom of the table by indicating N=(the number). |
Example of Graphs
|
|
|
The use of graphics are important to create an informative and compelling research report.
Infographics
Infographics are visual representations that combine numbers, visuals, and text to present ideas quickly and in a visually engaging way. They are popular because they can be shared easily in a variety of social media platforms. Infographics should illustrate the data so the reader can think about the data itself and not the specific details of the data or research. Creative use of fonts, color, simple graphics, and other graphic tools allow the evaluator to present numbers in a small space and make large amounts of data more coherent and compelling to the reader.
![]()
4.2 Developing Conclusions and Recommendations: The Grand Finale
Data reporting is the final stage of any research study. All reports need to be clear and concise in order to convey the significance, methodology and results of the study. Most park, recreation and leisure services research reports use the American Psychological Association (APA) format.
Developing conclusions is an on-gong process throughout an evaluation project, but at some point conclusions and recommendations must be finalized.
The researcher must organize their data to discuss the findings and develop conclusions.
Conclusions are drawn directly from the findings and are used to summarize the information from the study. Conclusions should relate directly to the criteria or research questions of the project. Conclusions state an interpretation of the findings.
Conclusions MUST be made by the researcher.
Present the conclusions based on the evidence collected in the study with justification for why they were made.
Conclusions are not difficult if the criteria for the study was clearly stated, the evaluation questions were explicitly stated and the data were reliable and valid.
Recommendations are the proposed course of action based on the conclusion. The recommendations define "what is to be done." Recommendations are specific, tactical proposals for action that eliminate, replace, or supplement current actions.
![]()
4.3 Report Writing: Saving a Paper Trail
The report is a written record of what the evaluator did and what they learned. The report may be a full report or a condensed version or an executive summary. the report length and type will be determined by the agency, the depth of the project, and how the information will be shared.
Reports should be comprehensive in addressing the research criteria, well-organized, and clearly written.
Report Organization
|
cover, includes the title of the research project, who/what was evaluated, names of evaluators, for whom the report was prepared, dates of the evaluation, and the date of the report. | |
|
executive summary/abstract, this is the first section and includes a concise description of the most important points of the study. It should not contain too much technical aspects. Usually less than 500 words. | |
|
table of contents, is a list of topic areas of the evaluation sections. | |
|
body, the body of the report describes the complete
study and usually includes the following sections. |
![]()
4.4 Oral Presentations: Telling the Tale
Oral reports may be the most effective method to distribute the research information.
Basic Principles of an Oral Presentation:
|
Present your material in terms of your purpose and audience | |
|
Make important points stand out | |
|
State the points as simply as possible |
The presentation needs to include a beginning, middle and end. Begin by telling the audience what you are going to tell them , tell them, and then tell them what you told them is an effective oral presentation strategy. Be sure to stay within your time limit.
Oral Presentation Format
|
introduction, is the purpose and process | |
|
body, is a brief description of the procedures and significant findings | |
|
conclusion, will present your recommendations |
Visual Aids:
|
slides - A good rule of thumb is "one slide per minute of talking." Do not read your slides and keep each slide on the screen for 5-6 seconds. | |
|
flip charts | |
|
PowerPoint | |
|
handouts | |
|
props |
Four most common voice errors
talking too softly
talking too fast
talking without expression
using vocalized pauses ("ok," "you know," etc)
![]()
4.5 Evaluating Projects and Studies: Pitfalls and Problems
No notes
4.6 Using Evaluations and Research for Decision Making: Back to the Beginning
No notes
[Unit 4]
![]() Copyright
2012. Northern Arizona University, ALL RIGHTS RESERVED
Copyright
2012. Northern Arizona University, ALL RIGHTS RESERVED